
DEX Monitoring with AI
When WARP client experiences issues, admins run diagnostic tests to troubleshoot. So ,how do we surface insights in an aggregate, easy-to-understand fashion.
Background on WARP connectivity
Here are some terms and definitions to better understand WARP and DEX:
WARP: Think of this as a highly secure, digital private shuttle for employees. Whenever an employee needs to access internal company tools (like an HR portal or a private database), the WARP app on their laptop securely drives their connection there.
DEX (Digital Experience Monitoring): This is the IT team's "check engine" dashboard. It monitors whether employees' laptops, internet connections, and the WARP app itself are running smoothly so people can actually do their jobs.
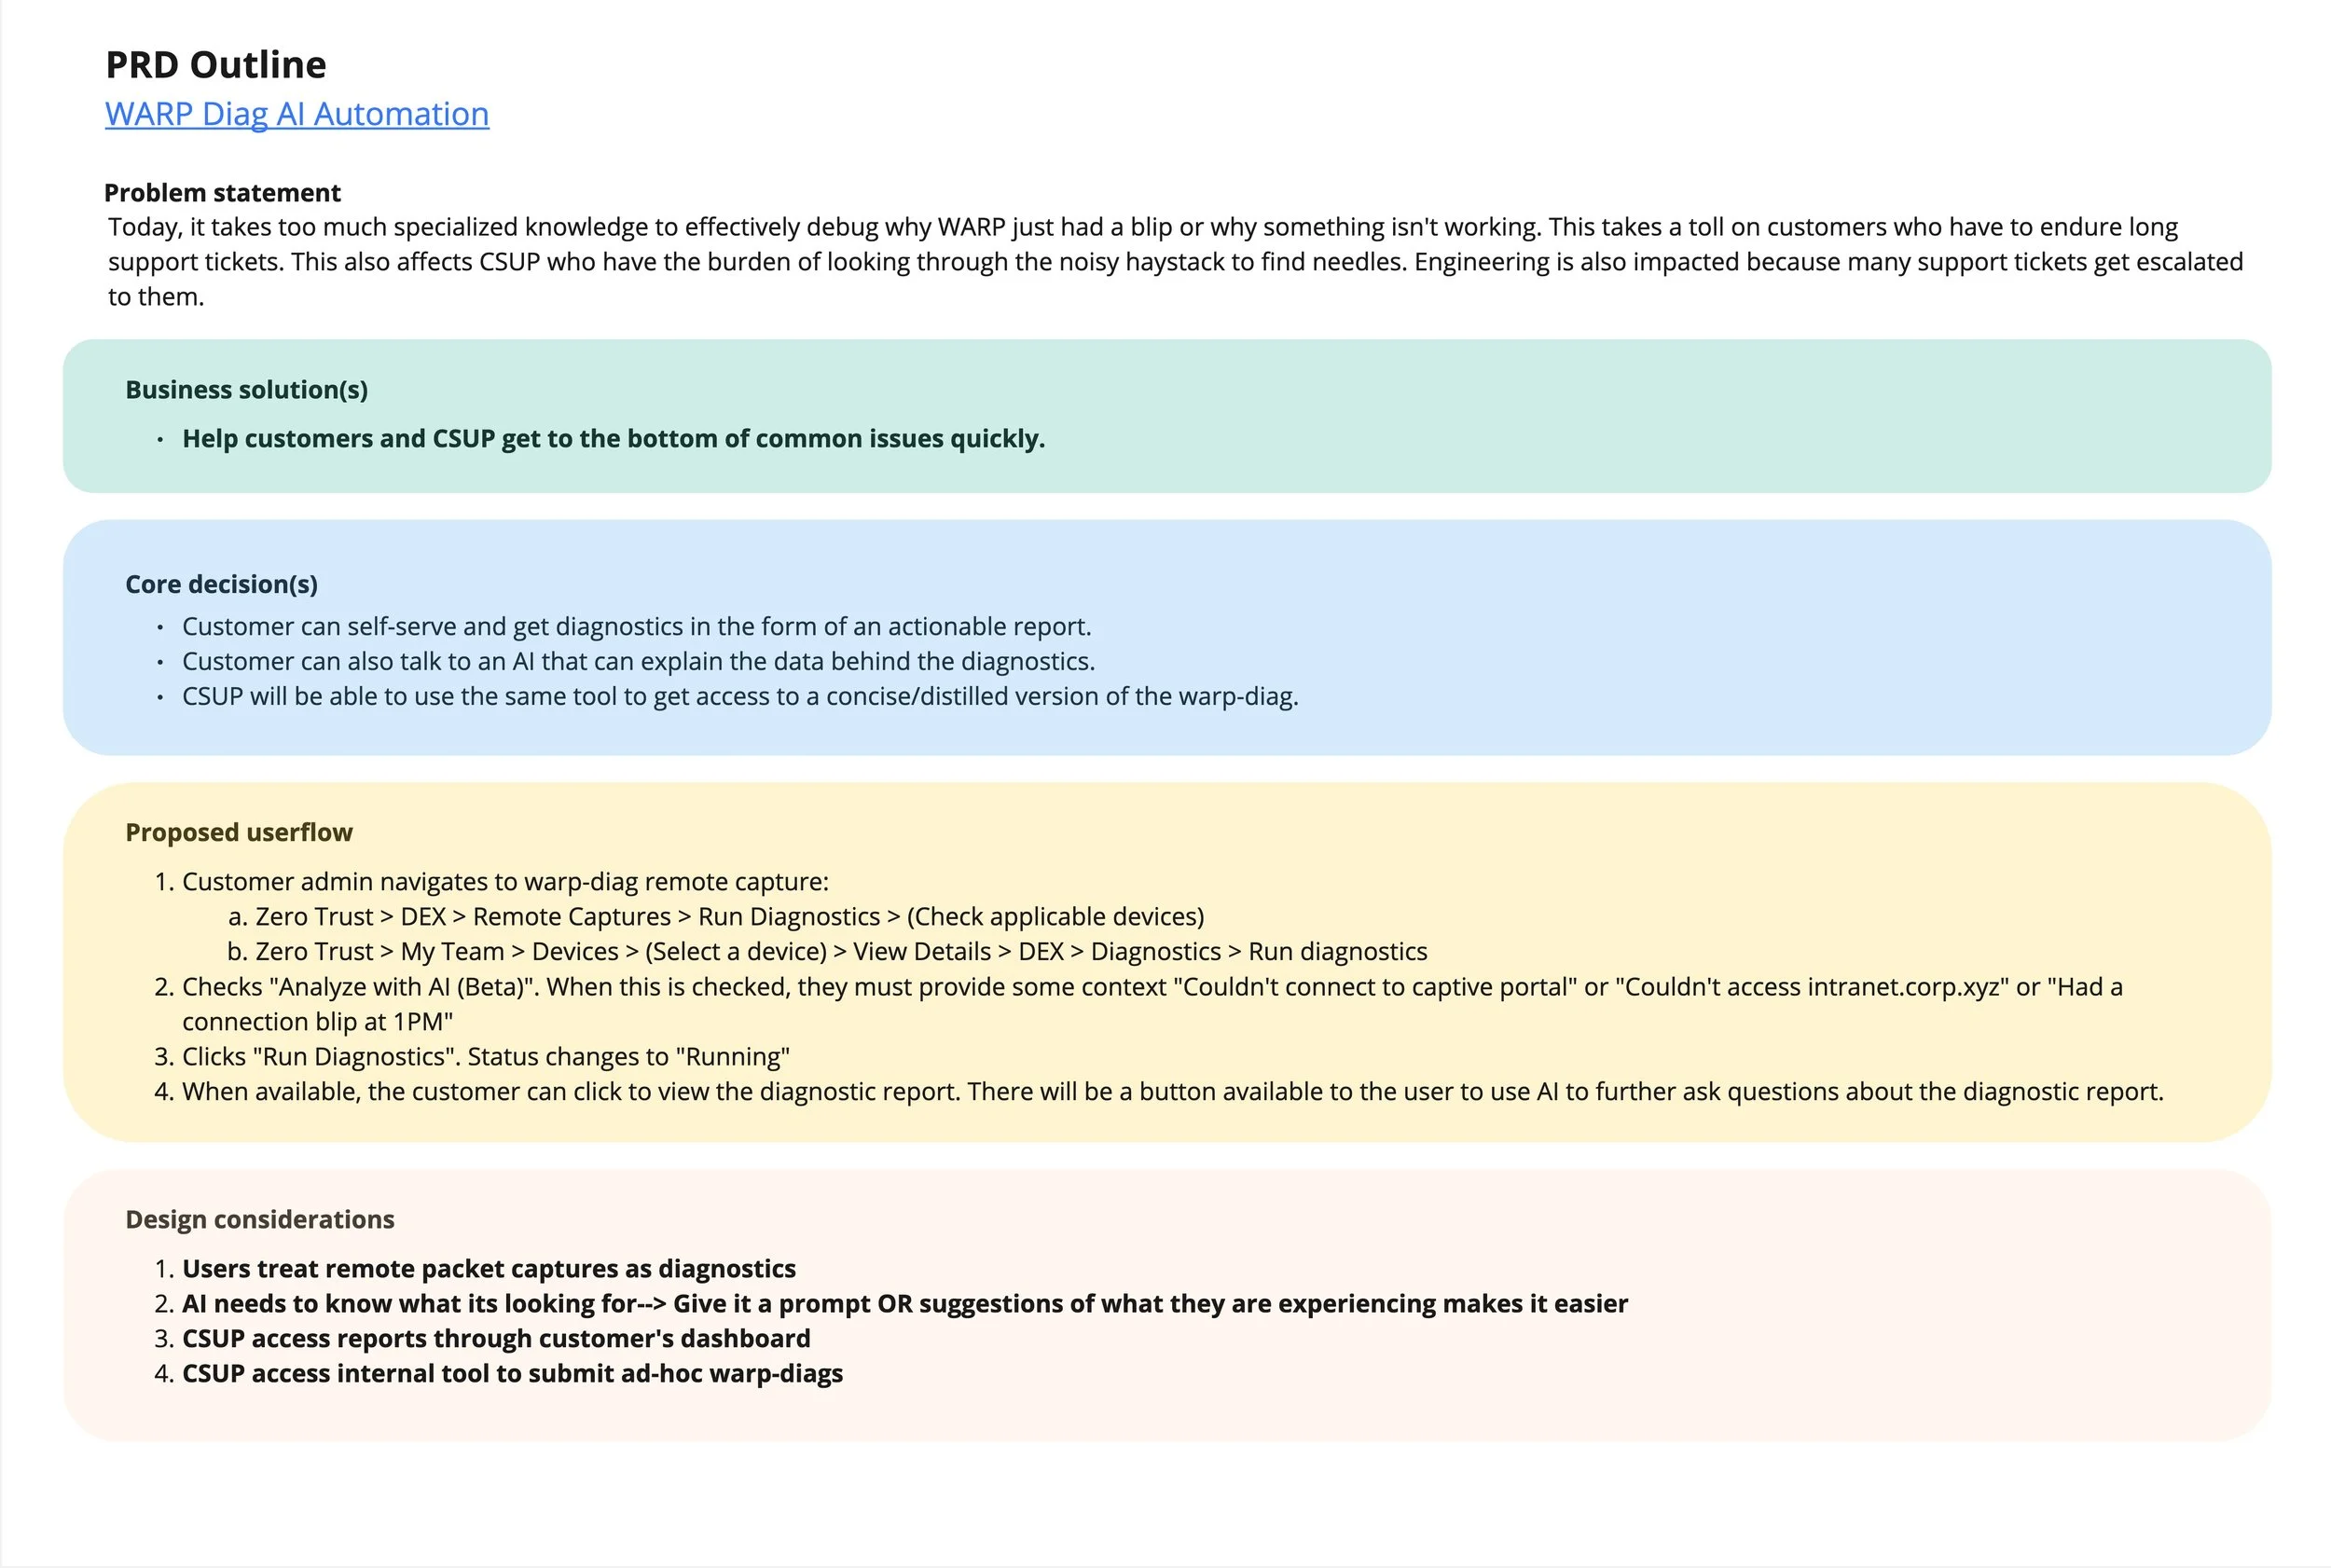
The goal of this project was to bridge the gap between raw diagnostic data and actionable troubleshooting. Instead of requiring IT admins to manually parse through massive JSON files or complex network logs to find the root cause of a connectivity issue, we integrated an AI layer to do the "heavy lifting."
The challenge: Improve the UX using AI-driven insights
The Problem (The "Before")
When an employee's internet randomly drops or they can't access an internal tool, they submit an IT support ticket.
To fix it, the IT administrator has to use the DEX dashboard to pull "diagnostic logs" from the employee's computer. The problem is that these logs are essentially thousands of lines of raw, messy computer code (JSON files). Finding the exact reason why the connection failed is like trying to find a needle in a haystack made of math. It takes highly specialized knowledge, consumes hours of IT's time, and leaves the employee unable to work.
The Solution (The "After")
I was tasked with designing a feature that largely automates this troubleshooting process using Artificial Intelligence.
Instead of an IT admin manually reading thousands of lines of code to guess what went wrong, you integrated an AI assistant that instantly reads the logs and translates them into plain English.
Kickoff
The first step in this process was creating a PRD outline, based on the requirements doc given via the PM and EMs. I outlined primary needs, using Google gemini to extract and explain the stickier parts of the product needs.
I next gave the existing UX a test run to evaluate the baseline experience, using a test account. Having extracted core user needs and leveraging a sense of empathy, I next outlined userflows and jobs-to-be-done, in order to solidify base user needs.
User research and baseline feedback
Deep diving into user personas and flows surfaced multiple pain pints within the existing UX, which included, but were not limited to:
Lack of urgency or outline of issues
Lack of informational hierarchy
Lack of a clear process visualization
Lack of an explanation
Lack of affordance on status pills
Having documented and experienced most of these core detractors I was now ready to start conceptualizing what the “fixed” experience would be.
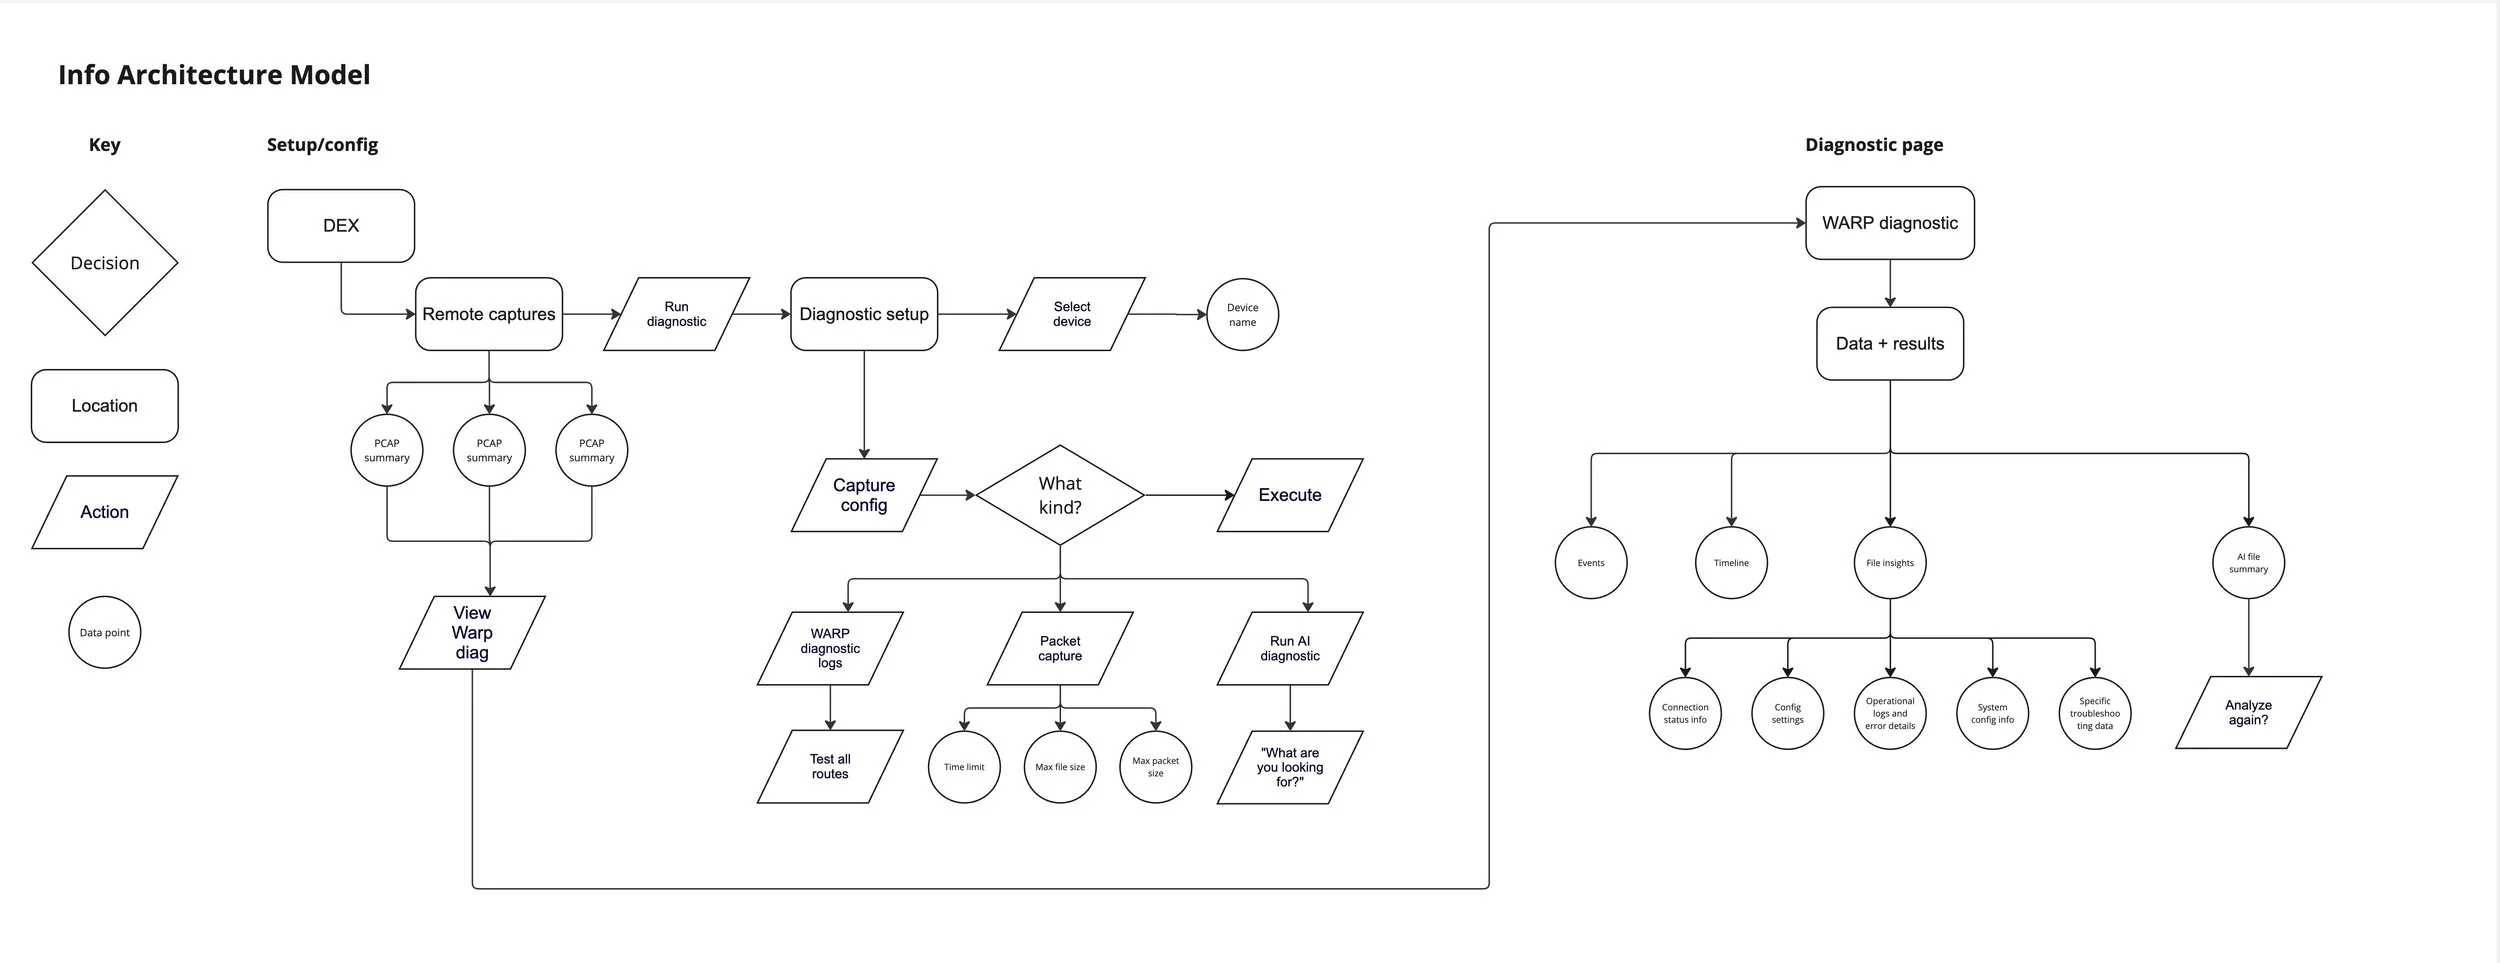
IA mapping and wireframes
Much of this project lived in the conceptual playground phase, which afforded the team an opportunity to collaborate and form the experience. I was able to design and iterate on concepts through visualizing the experience devoid of bells and whistles.
Stripping out the aesthetic allowed us the opportunity to focus more on the functionality and variance of user paths, through rapid prototyping and iterative share-outs. Solidifying the user flow through a decision-based flowchart allowed us the opportunity to play with different interactions in the wireframe phase.
This was especially valuable when discussing different interaction patterns for feedback and validation from the user. By remaining in concept we could quickly gain feedback from engineering and product, then iterate on specifications.
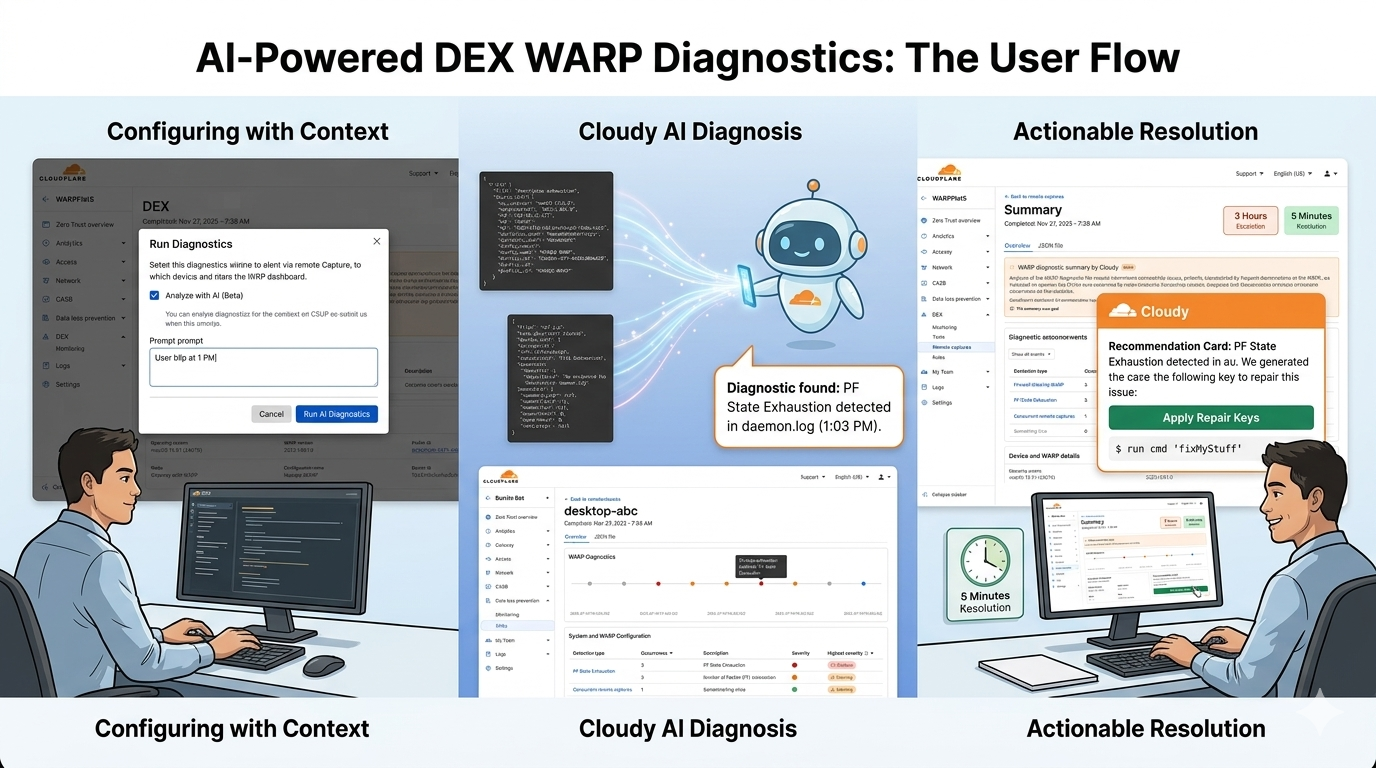
Cloudy and AI summaries
With this project having been a result of AI week in 2025, we were determined to implement the design in a way that scaled outwards and improved upon what we had learned previously.
Cloudy had been used in tangentially up to that point, primarily to summarize policies, rules and existing structures, (mostly within the firewall product suite). Our utilization would transform Cloudy into more of a diagnostic agent, by scanning and parsing JSON files for anomalies.
Additionally, we sought to gain tangible feedback from our user base regarding the AI summary tool and their interactions with it. Therefore, we crafted a feedback strategy using thumbs-up and thumbs-down for their experience with the tool. This validation strategy used a Dovetail tool to track users voting on the accuracy of their summary response.
Design implementation
Once the concepts were validated by the product team we moved into the role of high fidelity designs. Our core emphasis of implementation was the
One of the strongest contrasts in the design is the move from the "JSON raw" view to the "Overview" dashboard.
The Outcome: Instead of forcing an admin to search for pf_state_exhaustion in a text file, the "Events + Outcomes matrix" provides modular recommendations.
Implementation: We also illustrated specific remediation types, such as Repair keys (providing a direct CLI command like $ run cmd ‘fixMyStuff’) and Version Upgrades, ensuring the AI doesn't just "explain" the problem but actually offers a "path to green."
Detection types were also defined a clear taxonomy for how the AI categorizes its findings. This is crucial for handling edge cases where data might be ambiguous.
Critical: Highlighted in red, used for definitive failures like "PF State Exhaustion."
Warning: Used for issues that are likely causing the "blip" but aren't total failures.
No Detection: Ensuring that "all good" is still communicated so the admin knows the test actually ran.
WARP Diagnostics timeline
By placing events on a linear time scale, we allow admins to see if a "PF state exhaustion" event correlates with a specific user report or a spike in CPU utilization.
This visualizes the difference between a persistent failure and a transient blip, which is often the hardest edge case to debug in networking.
This component can also be interchanged with a table in chronological order
"AI needs to know what it's looking for."
The "Context" Edge Case: The flow requires the user to provide context (e.g., "Had a connection blip at 1PM"). This helps the AI narrow its focus, preventing it from hallucinating or highlighting irrelevant anomalies in the log haystack.
Interactive Refinement: The UI includes a "This summary was good / needs improvement" feedback loop, acknowledging that AI summaries can have inaccuracies—a key edge case for trust-building in Enterprise tools.
Outcome and summary
In short, we turned the data noise into “diagnostic signals”, significantly reducing the mean time to resolution:
Before: Admins had to download log files, search for error codes, and correlate network events manually.
After: The dashboard surfaces a natural language explanation of the problem (e.g., "The user is experiencing 15% packet loss on the local gateway") and suggests the exact fix.
Other impacts include:
WARP Diagnostics AI (The "Cloudy" Integration): We designed a flow where the system automatically analyzes WARP client logs. The AI provides a Human-Readable Summary of the device's state, highlighting specific issues like "high packet loss" or "misconfigured split tunnels."
Remote Capture Enhancements: Improved the "Remote Captures" feature, moving from a view of Raw JSON data (which you captured in your "JSON raw" screenshot) to a structured Overview dashboard. This allows admins to trigger diagnostic tests remotely and receive prioritized insights.
Information Architecture (IA) & User Flows: Now a streamlined path for the Security Admin. The flow moves from detecting an "unhealthy" device to viewing AI-generated recommendations and then taking a remediation action—all within a few clicks.
Primary Job Performers: Identified the specific needs of IT/Security Admins who need to solve "Why is this user's internet slow?" quickly. The AI acts as a tier-one analyst, triaging the data before the admin even sees it.